


You post a few times, the dashboard lights up, and the numbers still don't make sense. One post gets a lot of likes, another barely moves, and your team says the social media engagement rate looks strong anyway. Then you check a different platform and the picture changes again, which is why so many business owners feel like they're reading three different reports instead of one clear answer.
The confusion usually starts with a simple mistake. People treat engagement rate like one universal score, but it changes with the platform, the audience, the content, and, above all, the formula you use. Once you see how the denominator changes the story, the metric becomes a lot more useful.
Table of Contents
- Why Engagement Rate Confuses Most Business Owners
- How to Calculate Engagement Rate Correctly
- Platform Benchmarks and What They Really Mean
- How Content Strategy Affects Your Engagement Numbers
- The Problem with Treating Engagement as the Final Metric
- Practical Steps to Improve and Track Engagement Properly
Why Engagement Rate Confuses Most Business Owners
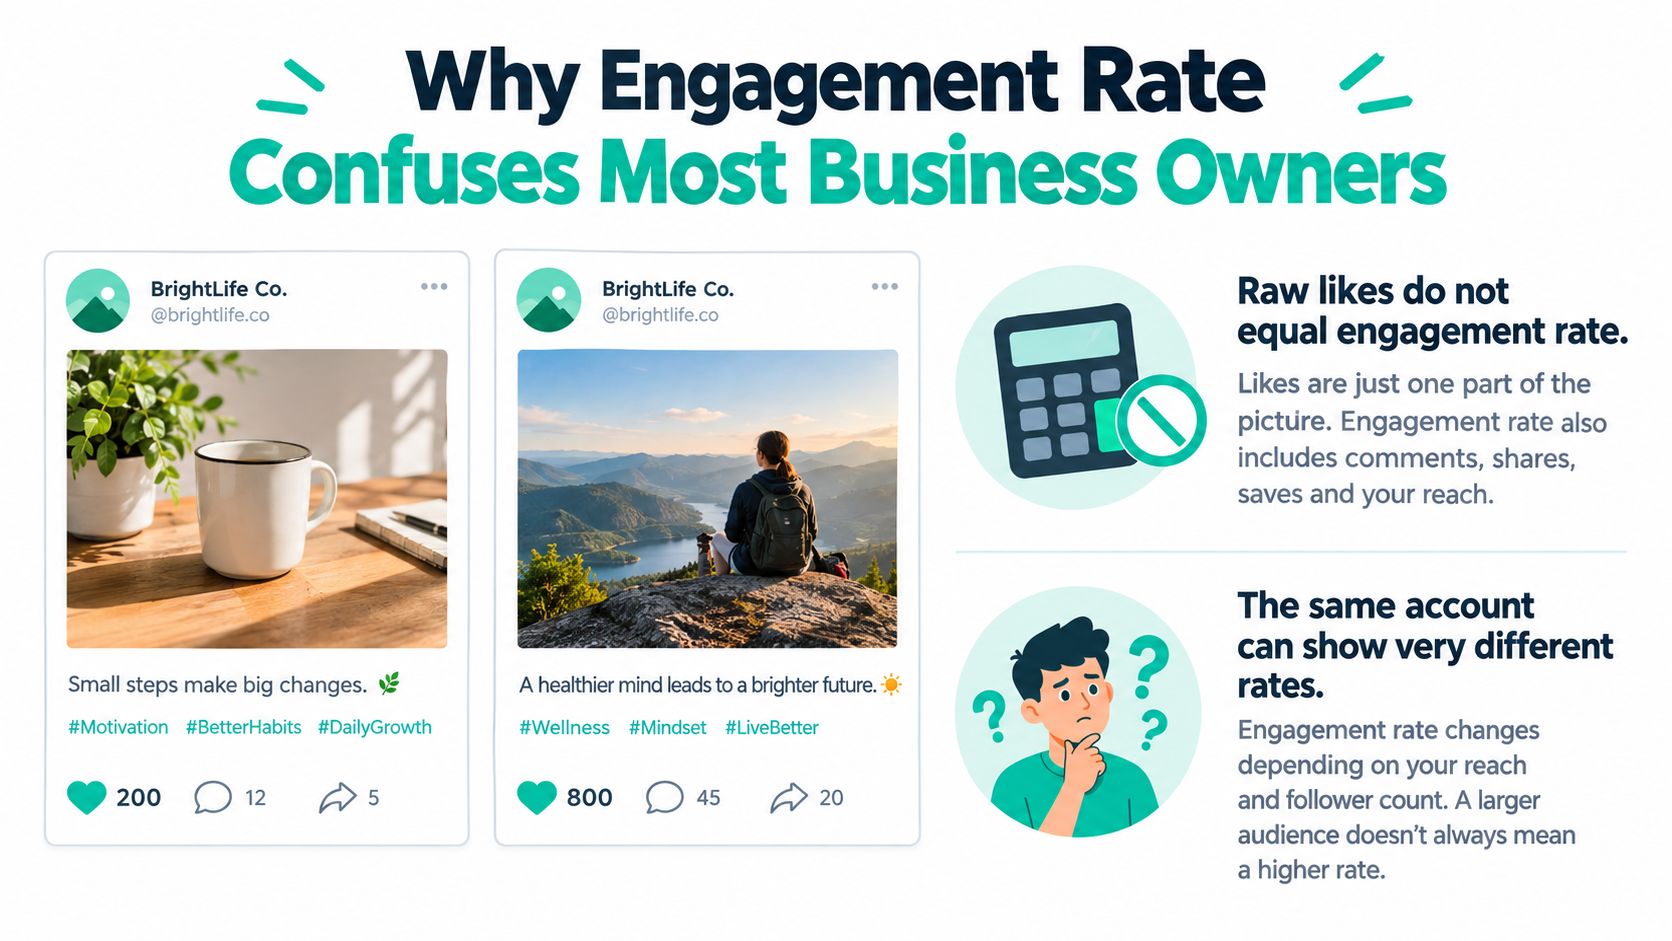
A common week for a business owner goes like this. You publish on Facebook and Instagram, one post gets 200 likes, another gets 800 likes, and your social media manager says the engagement rate is great. Then you open LinkedIn, where the raw interaction totals look much smaller, and it feels like your brand suddenly got worse.
That reaction makes sense, because raw likes and comments are only part of the picture. A 2023 peer-reviewed study found that engagement-rate means differed by region and platform, with Facebook averages of 1.151 for Latin American universities, 0.863 in the United States, and 0.720 in Europe, which shows how much audience and location shape the result (Wiley study). The same study also showed that posting more didn't automatically create stronger interaction, since Latin American institutions averaged 3.91 Facebook posts per day while U.S. and European institutions averaged about 1.15.
Why two posts can look similar and still perform differently
The trap is usually the denominator. One post can have the same number of interactions as another, but if one reached far more people, the rate will be lower. Another can look “better” just because the audience was smaller or more active.
Practical rule: never compare raw engagement without first asking, “What was this divided by?”
That's why comparing Instagram to LinkedIn without checking the formula is misleading. A platform can look weak in raw interactions and still be strong in response among the people who saw the post. The internal logic of the number matters more than the headline percentage, which is also why a general digital marketing view helps put social data in context, like the broader channel mix explained in this digital marketing guide.
How to Calculate Engagement Rate Correctly
The cleanest way to think about social media engagement rate is as a percentage of active interaction against some audience measure. The two most useful versions are follower-based and exposure-based. They answer different questions, so you shouldn't treat them as interchangeable.
Start with the formula that matches the question
The University of Houston explains two useful calculations, public engagement rate and engagement rate based on exposure. Public engagement rate uses total engagements divided by followers, then multiplies by 100, while exposure-based rate uses total engagements divided by impressions, then multiplies by 100 (University of Houston). In plain English, the first asks how responsive your community is, while the second asks how well a post performed among people who saw it.
Here's a simple business example. An HVAC company in the USA has 5,000 followers on Facebook, its post reached 8,000 unique accounts, and it earned 240 likes, 30 comments, and 15 shares. The follower-based rate is 5.4%, because 285 engagements divided by 5,000 followers equals 5.4%. The exposure-based rate is 3.56%, because 285 engagements divided by 8,000 reach equals 3.56%.
Practical rule: use follower-based rate when you want a stable community-health snapshot, and use reach-based or impression-based rate when you want to judge the post itself.
Why reach is usually the better post-level denominator
For post analysis, reach usually tells the clearer story because it reflects the people exposed to that specific post, not the whole follower base. That matters because follower counts can include inactive accounts, people who don't see every post, or followers who aren't in the market right now. The same content can look excellent by one formula and average by another, and both can still be technically correct.
| Formula | Denominator | Best Used For | Example Result |
|---|---|---|---|
| Public engagement rate | Followers | Account health and audience responsiveness | 5.4% |
| Exposure-based engagement rate | Reach or impressions | Post performance among people who saw it | 3.56% |
Keep the formula visible in your reporting. If the denominator changes, the meaning of the number changes too.
Platform Benchmarks and What They Really Mean
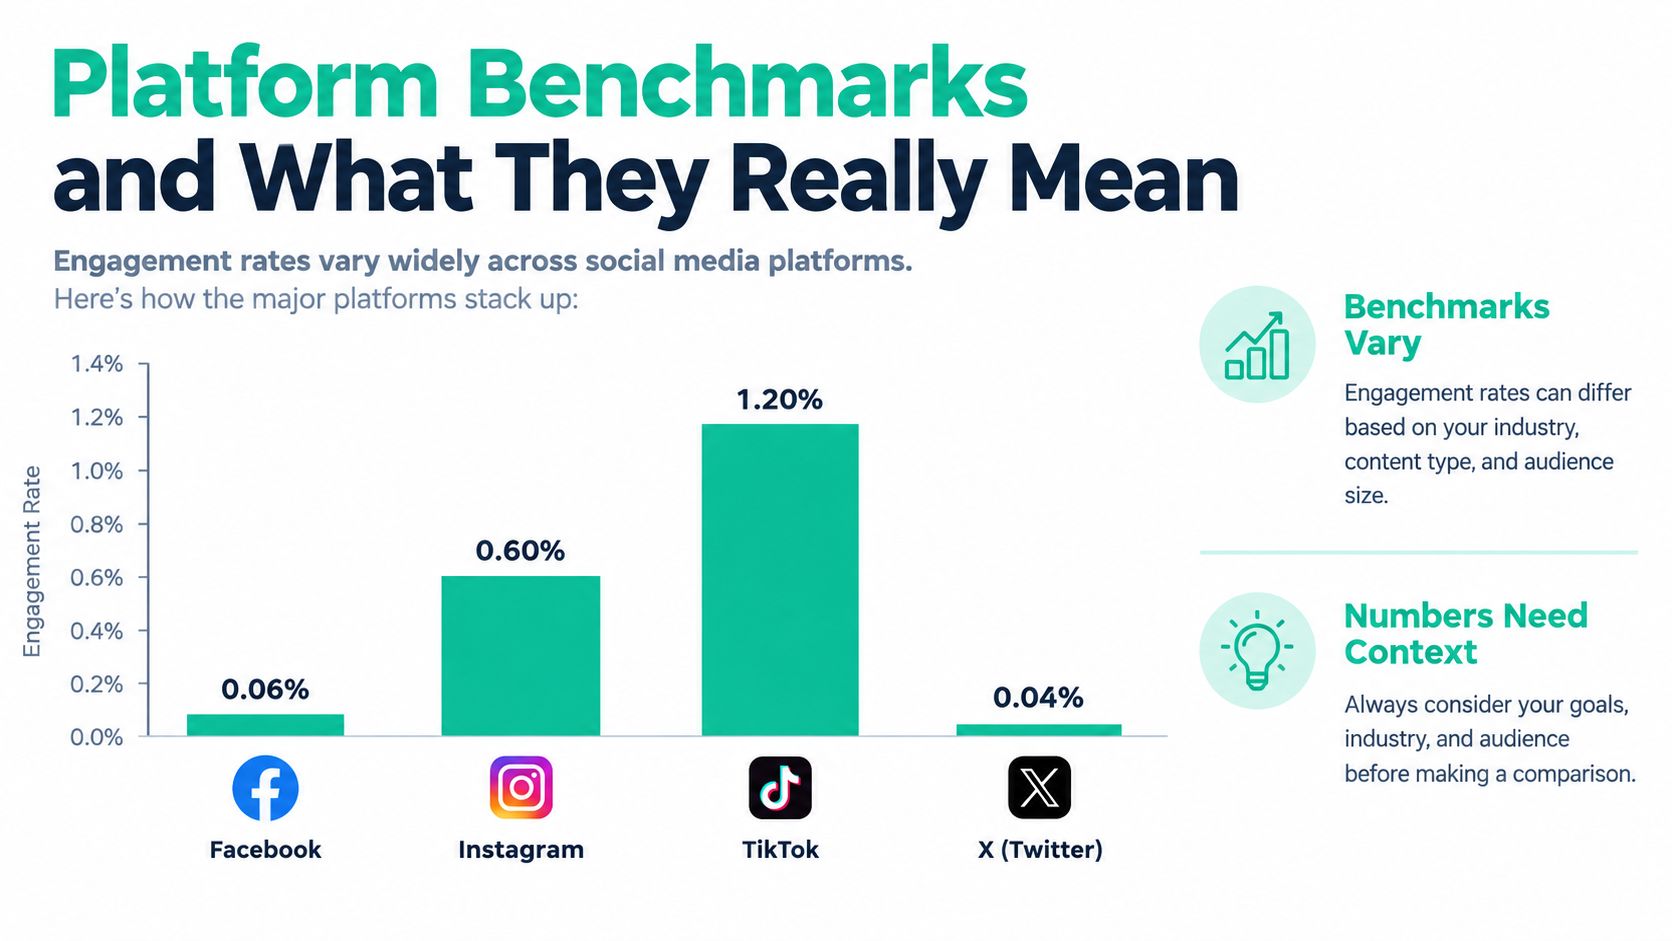
People often ask what a “good” engagement rate is, but the answer depends on the platform and the formula. A published cross-platform benchmark dataset analyzed more than 52 million posts and reported median engagement rates of approximately 6.2% for LinkedIn, 5.6% for Facebook, 5.5% for Instagram, 4.6% for TikTok, 4.0% for Pinterest, 3.6% for Threads, and 2.5% for X. Those figures used engagements divided by reach, with impressions or views when reach wasn't available (Buffer benchmark dataset).
That sounds useful, but it's not a universal scoreboard. The same source says the dataset uses 2025 data as a baseline and defines engagement primarily as engagements divided by reach, which means the platform and denominator both matter. That's why a law firm on LinkedIn and a retail brand on Instagram shouldn't expect the same pattern. The audience is different, the content is different, and the interaction style is different.
Benchmarks are guides, not verdicts
A benchmark is useful when it helps you set direction. It becomes misleading when you use it as a pass-fail line without context. A lower rate can still be a good result if the audience is narrow, the content is highly qualified, or the goal is conversation rather than broad reach.
The 2023 peer-reviewed study adds more context here. It cited commonly reported platform benchmarks of 0.06%–0.18% for Facebook, 0.04%–0.07% for Twitter, and 0.25%–0.50% for LinkedIn, which shows how benchmark ranges shift depending on how they're measured (Wiley study). That's a reminder to compare like with like, not one dashboard against another.
Cross-Platform Median Engagement Rates 2025-2026
| Platform | Median Engagement Rate | Primary Denominator |
|---|---|---|
| 6.2% | Reach | |
| 5.6% | Reach | |
| 5.5% | Reach | |
| TikTok | 4.6% | Reach |
| 4.0% | Reach | |
| Threads | 3.6% | Reach |
| X | 2.5% | Reach |
A short video can outperform a static update on one channel and underperform on another, which is why your own history is often more useful than a generic industry average. The best benchmark is usually your own past performance measured the same way every time.
How Content Strategy Affects Your Engagement Numbers
Engagement rate isn't just a measurement issue, it's a content issue. What you publish shapes how people respond, and different creative choices drive different kinds of interaction. That's why a post can earn a lot of likes and still do very little for pipeline.

Different content types trigger different behavior
A Stanford field study of more than 100,000 Facebook messages from 800 companies found that humor, emotional framing, and philanthropic brand positioning increased likes, comments, and shares, while purely informative attributes such as price, availability, or product features reduced engagement when used alone (Stanford study). The useful detail is that informative content still worked better when it was paired with brand personality.
That matters for a practical business decision. A home services company can post a dry service explanation, or it can post the same explanation with a local story, a customer problem, or a question that invites response. A law firm can explain a legal issue plainly, or it can frame the issue through a client scenario that feels more human. The second version often gets more interaction because people respond to context, not just facts.
A useful test: compare an informational post against a version with one added human element, then judge both attention and action.
Two objectives beat one headline number
The cleanest approach is to test for two outcomes at once. Measure interaction rate for attention, then measure qualified click-through or conversion rate for commercial intent. A post that gets more comments may be better at building awareness, while a different post may send fewer reactions but more serious visitors to your site.
That's where a funnel mindset helps, especially when you're connecting social posts to content journeys like the ones outlined in this funnel example. The point isn't to chase the highest reaction count. The point is to learn which creative choices help the right audience move forward.
The Problem with Treating Engagement as the Final Metric
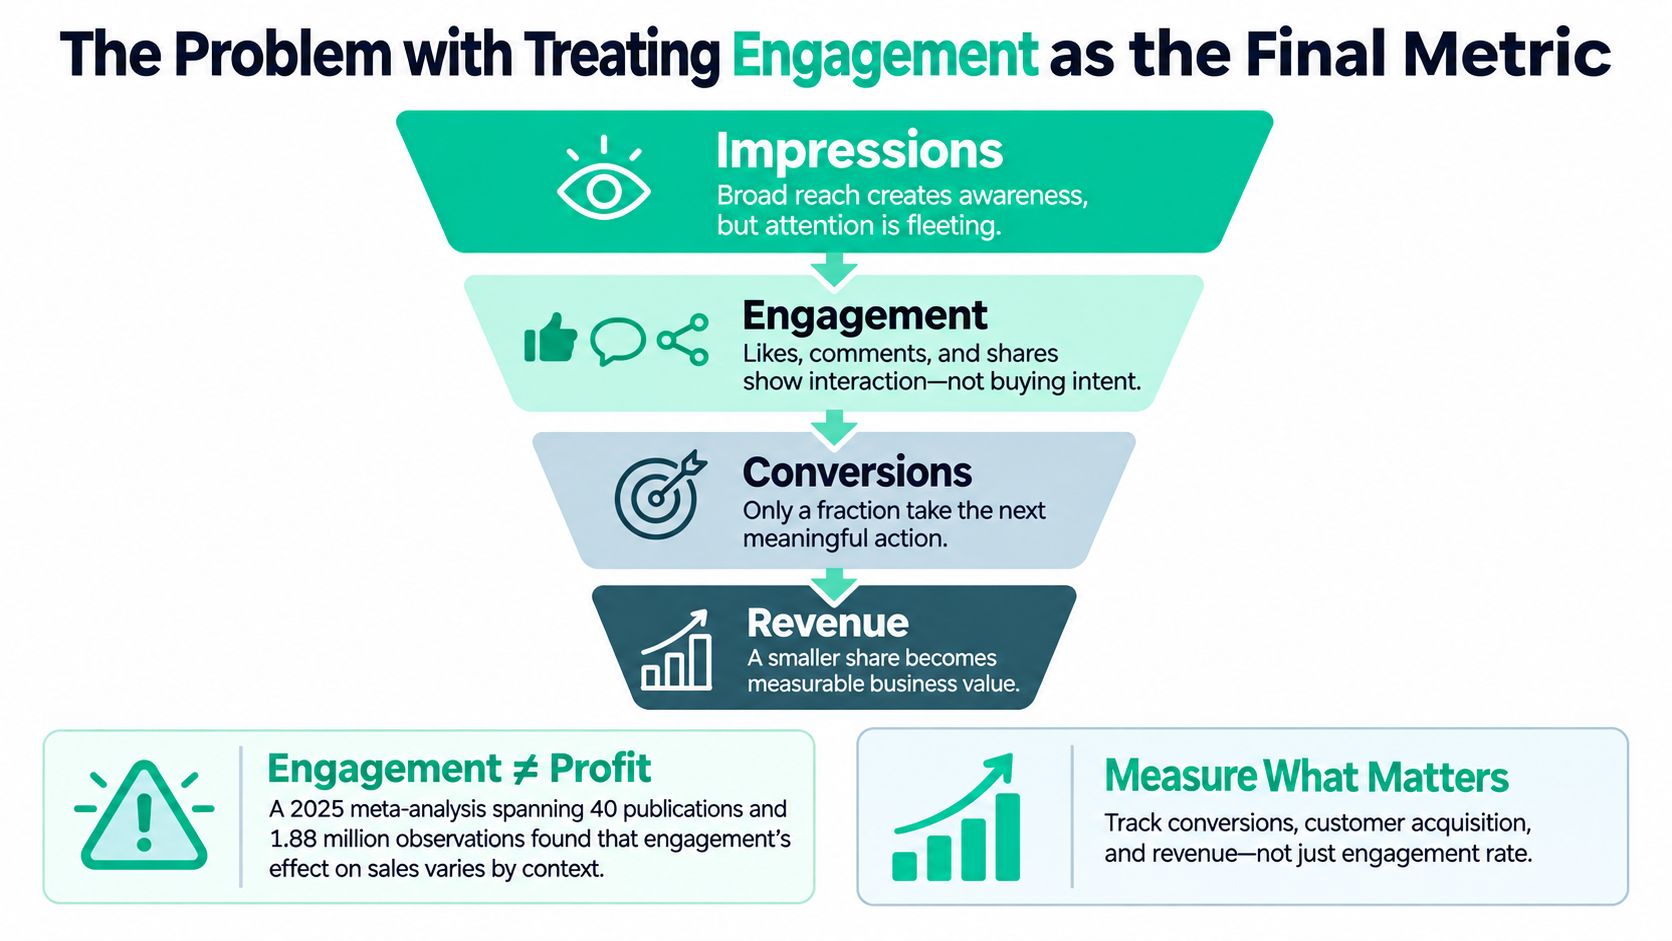
High engagement can feel like proof that a campaign worked, but that's not always true. Engagement is an input, not the finish line. A post can spread widely, collect plenty of interaction, and still leave your sales team with very little to work with.
A 2025 study of nearly 3,000 global companies reported that engagement rates differed by platform and were calculated from activity during only January through June 2025, which makes the benchmark a snapshot rather than a permanent standard (Dash Social benchmark). That matters because platform algorithms shift quickly, and a rate that looked strong earlier in the year can lose meaning after ranking changes or new features.
Engagement can rise while business impact stays flat
A viral post can attract people who aren't in your target market. It can inflate reach, create a burst of likes, and still produce very few visits, calls, form fills, or purchases. A quieter post can do the opposite, especially if it speaks to a narrow but valuable audience.
Academic research treats engagement as context-specific, not as one stable construct, and that's the more useful way to think about it in practice. For a local HVAC company, a law firm, a retail brand, or a small services business, the important question is whether social attention turns into measurable action. That means looking at saves, shares, profile visits, clicks, calls, form submissions, and assisted conversions alongside the engagement percentage.
Track the outcome, not just the reaction
Practical rule: if a post earns attention but never contributes to qualified traffic or revenue, it needs a different job in your strategy.
That's also why the reporting conversation should go beyond the social dashboard. A strong report connects social metrics to CRM data, website analytics, and lead quality. If a post drives lots of comments but no calls, that's a signal. If a smaller post produces fewer reactions but more booked estimates or consultations, that's the one with business value.
For teams comparing agencies or planning a social program, the central question isn't “Did engagement go up?” It's “Did engagement help the business grow?” A good agency process should make that distinction explicit, like the guidance in this agency selection resource.
Practical Steps to Improve and Track Engagement Properly
The easiest way to improve social media engagement rate is to stop treating it as a single number. Better reporting starts with better labeling, and better improvement starts with better testing. If your team can't explain the formula, the number won't hold up in a real business conversation.
Make the metric auditable
Every report should show the formula, the platform, the audience size, the reach, and the content type. That way, no one has to guess whether the number is based on followers, reach, or impressions. Keep the raw counts too, because a percentage without its base can hide more than it reveals.
Practical rule: if the denominator changes, call it out in the report.
Separate attention from intent
Don't collapse every interaction into one bucket. Comments, shares, saves, profile visits, link clicks, and conversions all mean different things, so track them separately when you can. A share is not the same as a click, and a click is not the same as a lead.
Test creative with business outcomes attached
Run monthly tests that compare interaction rate with qualified click-through or conversion rate. Hold audience, spend, placement, and call to action constant, then change one thing at a time, like tone, story, or framing. That makes it much easier to see what really moved the result.
Keep the dashboard honest
Retain raw counts, reach, impressions, follower count, posting frequency, paid-versus-organic status, and content format. Those fields make the rate easier to audit and harder to misread. They also protect your team from judging a campaign favorably just because the denominator changed.
For teams that want help connecting creative testing with reporting, social management, and lead-focused measurement, Assertive Agency builds and tracks campaigns across Facebook, Instagram, LinkedIn, and TikTok as part of a broader performance program.
If you want your social metrics to mean something in the boardroom, not just inside a dashboard, work with a team that ties creative testing to leads and revenue. Visit Assertive Agency to see how strategy, content, paid social, and reporting can work together around the numbers that matter.
