


The most popular advice on how to improve Core Web Vitals is also the least useful. Compress images, install a caching plugin, run PageSpeed Insights, repeat until the score turns green. That treats your whole site as one problem, and it sends you to fix pages nobody visits while your product template, checkout, or lead form keeps failing for real buyers on mobile phones.
I would flip the order. Find which templates fail in real user data, check how much traffic and revenue those templates carry, and spend your time there first. A single fix to a shared template can help thousands of URLs. A perfect score on a quiet blog post does not pay for the work.
Table of Contents
- Core Web Vitals Targets and What Each Score Means
- How to Find the Pages That Fail First
- How to Speed Up Largest Contentful Paint
- Fixing Slow Interactions and Layout Shifts
- Mistakes That Keep Core Web Vitals Scores Stuck
- Confirm Field Data Improves Before You Stop
Core Web Vitals Targets and What Each Score Means
Start with three numbers. Google's thresholds are set out in Google's Core Web Vitals documentation for Search, where Largest Contentful Paint (LCP) should be 2.5 seconds or less, Interaction to Next Paint (INP) should be below 200 milliseconds, and Cumulative Layout Shift (CLS) should be 0.1 or lower.
In plain terms, LCP tells you how fast the main content shows up. INP tells you how quickly the page responds when someone taps, clicks, or types. CLS tells you how much visible content jumps around without the visitor causing it.
| Metric | What it measures | Good | Needs improvement | Poor |
|---|---|---|---|---|
| Largest Contentful Paint (LCP) | How fast the main content becomes visible | 2.5 seconds or less | 2.5 to 4 seconds | Over 4 seconds |
| Interaction to Next Paint (INP) | How quickly the page responds to clicks, taps and key presses | 200 milliseconds or less | 200 to 500 milliseconds | Over 500 milliseconds |
| Cumulative Layout Shift (CLS) | How much visible content moves unexpectedly | 0.10 or less | 0.10 to 0.25 | Over 0.25 |
Why the old FID report is not enough
Interaction to Next Paint replaced First Input Delay as a Core Web Vital on March 12, 2024, because INP captures responsiveness across the full interaction lifecycle rather than focusing primarily on the first interaction, as explained in the Chrome UX Report API guide. If an old report still shows FID, treat it as incomplete. It can hide slow menus, filters, and form fields that show up later in the visit.
Passing is also stricter than many expect. You don't pass based on a good average. The 75th percentile of real visits must meet each target, so the slower quarter of your audience determines whether you remain stuck.
That matters for money, not just rankings. Each extra second of load time cuts conversions by about 7%, from a 3% baseline. A failing template with steady traffic is charging you every day.
Practical rule: Write down the failing metric for each template before you change code. LCP, INP, and CLS point to different fixes, and guessing wastes the release.
That short list becomes your work plan. Product page failing LCP is an image and rendering job. Lead page failing INP is a JavaScript job. Blog template failing CLS is a layout job. Don't mix them together.
How to Find the Pages That Fail First
Don't start with your homepage because it's easy to test. Start where Google groups similar pages and where your analytics show value. This routine takes an afternoon and stops weeks of random tuning.
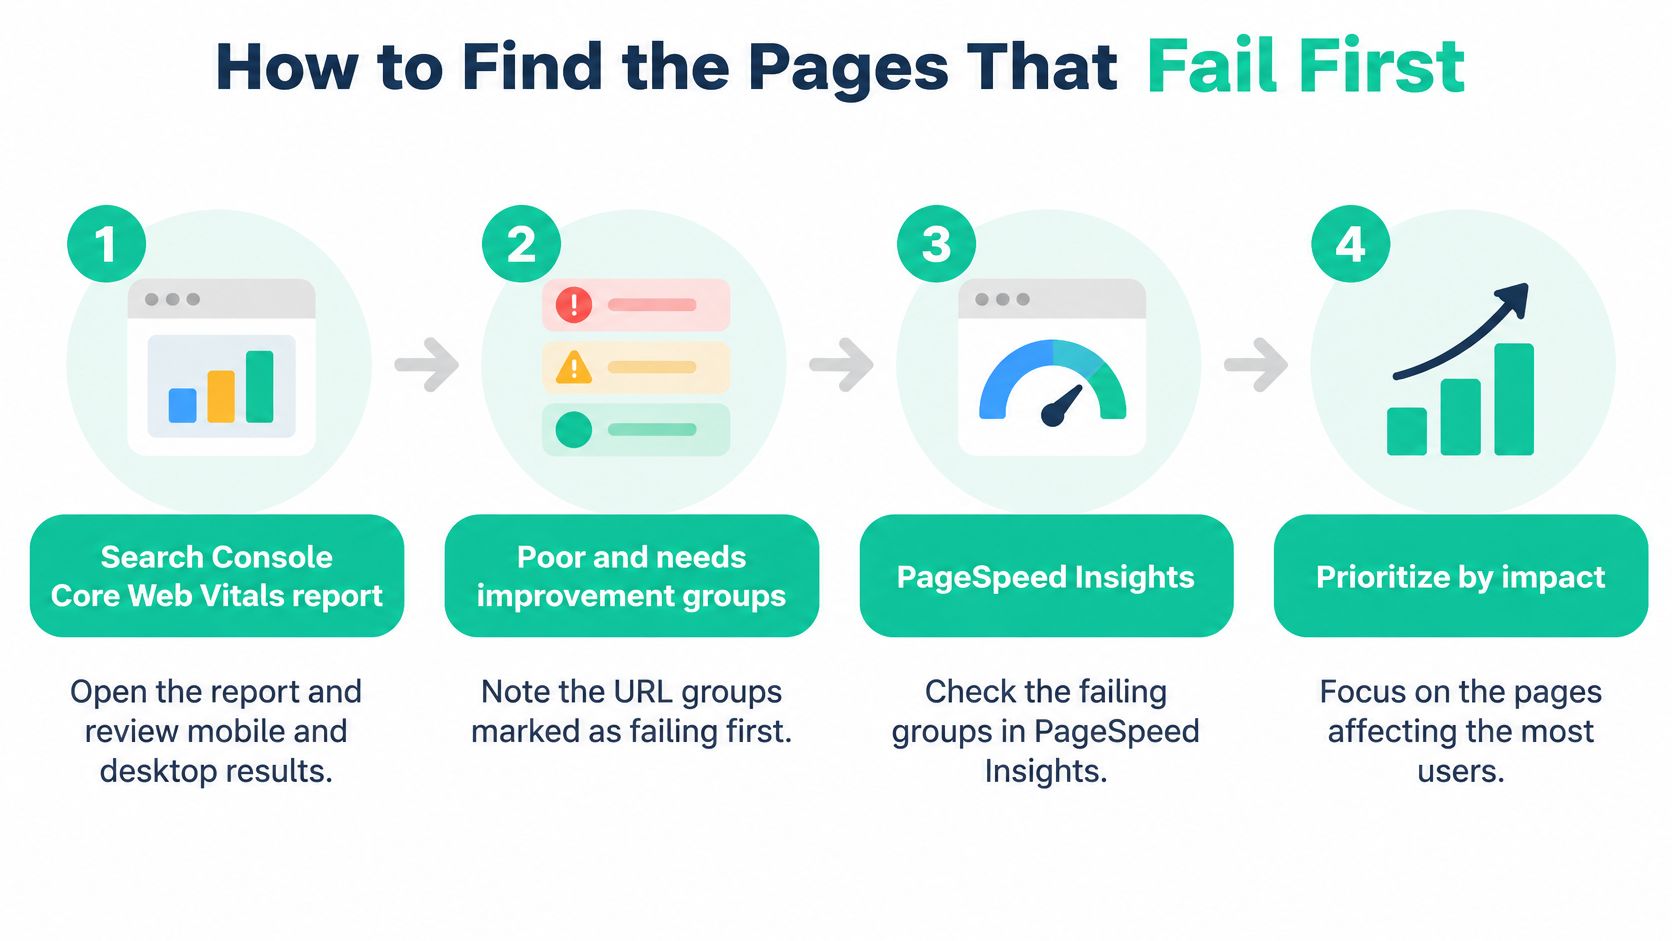
A six step routine for picking targets
Open Search Console first. Go to the Core Web Vitals report and switch between mobile and desktop. Note which URL groups are marked poor or needs improvement, because mobile failures are often hidden by clean desktop results.
Check field data in PageSpeed Insights. Test a sample URL from each failing group and read the field data section, not just the lab score. As Google's PageSpeed Insights documentation explains, Core Web Vitals are evaluated using real-world field data at the 75th percentile of page loads, segmented by mobile and desktop, and a page passes only when all three metrics are good at that level.
Add business value from GA4. Pull sessions, leads, and revenue for each URL group. A failing group that drives calls or sales outranks a failing group with little traffic, even if its score looks worse.
Group URLs by template. Sort pages into product, category, blog post, service, and lead landing page templates. One shared header, hero, or script fix can lift every page built on that template.
Pick two or three templates. Choose the ones that combine a failing metric with high traffic or revenue. That's your first release list, not the whole site.
Record a baseline. Save the score, device type, date, and sample URLs for each pick. Without a baseline, you can't prove the fix worked or spot a regression later.
Field data matters because a fast lab test on a strong office connection says little about a visitor on a mid range Android phone. The Chrome UX Report and Search Console use field data from real Chrome users over a rolling 28-day period, segmented by mobile and desktop, as described in the Core Web Vitals statistics guide from PageSpeed Matters. That also means a fix won't show up overnight.
Say a store has a shared product template failing LCP on mobile across thousands of URLs, while one blog post with a handful of monthly visits also fails. Fix the product template first. The blog post can wait until the money pages pass.
If you need a wider technical check before you commit developer time, use our guide to the best free SEO audit tools to cross check what Search Console is showing you across the rest of the site.
How to Speed Up Largest Contentful Paint
Find the LCP element before you optimize anything. On most templates it's the hero image, product photo, or main headline. Confirm it in PageSpeed Insights diagnostics or in the Chrome DevTools Performance panel. If you guess wrong, you'll shrink the wrong file and wonder why nothing moved.
The image below shows the kind of check you should run before touching settings, with the LCP element named on screen.

Work through the page in load order
Cut server response time. Turn on full page caching, use a CDN, and check time to first byte before and after. If the server is slow, every later fix fights uphill.
Remove render blocking files. Inline the critical CSS needed for the first screen and defer CSS and JavaScript the first screen doesn't need. The browser can't paint the hero while it's waiting on unused styles.
Size and convert the LCP image. Serve it in WebP or AVIF at its real display width. Compress it until just before quality drops, because a blurry product photo can cost more sales than a slightly heavier file.
Put the image in the initial HTML. The browser should find it in the page source right away. An image injected later by JavaScript or buried in a CSS background gets discovered late, and late discovery means late paint.
Preload only the true hero asset. Use a hint like for that one file. That tells the browser this image matters more than everything else waiting in line.
Never lazy load the LCP image. Lazy loading is right for images below the fold. On the hero, it tells the browser to wait, which is the opposite of what you want.
Preloading five or six files doesn't make a page faster. It makes those files fight with fonts and CSS for bandwidth, and the hero often loses.
Over preloading is the slip I see most in fixed sites that stay slow. A site owner adds preload tags for the logo, hero, banner, font, and slider images, then can't tell why LCP got worse. One priority asset works. Six priority assets means nothing has priority.
The walkthrough below shows how these LCP checks look in practice, so you can follow the same order on your own template.
Success has two stages. First, your lab test on throttled mobile should show the LCP element painting inside the good range with the hero loaded eagerly and nothing blocking it. Second, your field data should trend down over the next reporting cycle. The first stage proves the fix is real. The second proves visitors feel it.
This work is easier when the template was built with speed in mind from the start, which is why page structure and image handling belong in any plan for SEO friendly website design instead of getting bolted on after launch. Good design decisions upstream prevent most LCP fights downstream.
Fixing Slow Interactions and Layout Shifts
The most common INP complaint sounds simple. A visitor taps a menu or filter and nothing happens for a beat. The page looks loaded, so the owner blames the network. In most cases the browser is busy running JavaScript and can't respond yet.
Slow taps usually mean a busy main thread
Interactions stall when the main thread is tied up with long JavaScript tasks. The usual sources are third party tags. Chat widgets, ad scripts, tag managers, heatmaps, and A/B testing tools all ask the browser to do work, often on every page whether the visitor needs them or not.
Profile the slow action instead of guessing. Open the Chrome DevTools Performance panel, record while you click the menu, open the filter, or type in the form, and look for the long tasks that block the response. Then fix the work, not the symptom:
- Split long tasks. Break big jobs into smaller chunks and yield to the browser between chunks, so it can paint the response sooner.
- Defer nonessential scripts. Load chat, reviews, and similar tools after the first interaction or after the main content is usable.
- Remove tags nobody owns. Old test pixels and duplicate analytics tags are common on WordPress and WooCommerce sites. If no report depends on a tag, it's a candidate for removal after testing.
- Trim per template. A slider or review script that only belongs on product pages shouldn't run on your lead pages and blog posts too.
For WordPress and WooCommerce sites, start with the theme and plugins before editing core files. Page builders, sliders, review widgets, and chat tools often load sitewide. Check which scripts run on the failing template and turn off what that template doesn't use. That's often a settings change, not a rebuild.
Layout shifts are a spacing problem
CLS is more mechanical. Content jumps because the browser didn't know how much room something needed until it arrived. Fix that by reserving space before anything loads:
- Set dimensions on media. Add width and height to images and video so the browser holds the box open.
- Use aspect ratio for embeds. Give iframes, maps, and video embeds a CSS aspect-ratio or fixed container.
- Fix the slot for late arrivals. Ads, consent banners, cookie notices, and promo bars need a reserved slot at render time. Never insert a banner above content that's already on screen.
Use this table as a lookup when a visitor or a test shows you a symptom.
| Symptom | Likely cause | Fix |
|---|---|---|
| Menu or button responds a second late after a tap | Long JavaScript task from third-party tags | Defer nonessential scripts and split long tasks into smaller chunks |
| Text and buttons jump as the page finishes loading | Images, embeds or ads without reserved dimensions | Set width, height or aspect-ratio and give ad slots a fixed size |
| A banner pushes content down a few seconds after load | Consent or promo bar inserted above existing content | Reserve a fixed slot at render time so nothing is inserted above the content |
| Typing in a form lags on mobile | Heavy chat or analytics script running on each keypress | Load chat after the first interaction and remove unused tags |
Some rows are quick config changes, like adding image dimensions in your theme settings or delaying a chat widget in its dashboard. Others need a full release, like splitting JavaScript bundles or rebuilding a consent banner slot. Mark which is which in your plan so quick wins ship this week instead of waiting behind developer work.
I would sequence it this way. Reserve space for images, ads, and banners first because those fixes are cheap and stable. Then profile and cut JavaScript, because that work needs testing against forms, carts, and tracking before it goes live.
Mistakes That Keep Core Web Vitals Scores Stuck
The most expensive mistake is deleting tags on a hunch. A site owner removes analytics, chat, or a marketing pixel, the score improves a little, and then lead tracking breaks for a month. Nobody notices until reporting day.
Test the tag first. Measure how much it adds to input delay or layout shift, then ask what report or workflow depends on it. If it tracks purchases or qualified leads, it probably earns its place. Load it after the first interaction, limit it to the pages that need it, or replace it with a lighter option. Remove it only when the data says it's dead weight.
Check before you cut: If you can't name what a tag feeds and what it costs in delay, you're not ready to delete it.
The second mistake is judging the whole site by the homepage. Homepages get the most design attention and often pass, while the template that makes money fails unnoticed. Say an online store has a homepage that passes every metric, but its product template fails LCP on mobile across thousands of URLs because every product photo loads oversized and lazy. One change to that shared template moves most of those URLs toward good. The homepage never needed work at all.
That's the same trap covered in our breakdown of common landing page optimization mistakes, where teams polish the page they look at most instead of the page visitors struggle with. Check each template on its own, with its own traffic and revenue attached. A sitewide average score will hide the failure that's costing you.
Confirm Field Data Improves Before You Stop
A green lab score on release day is not proof. It's a reason to keep watching. The checks below show whether real visitors got a faster page.
Start locally. As the Chrome DevTools performance documentation describes, DevTools allows testing with settings such as Fast 4G, a 20-times CPU slowdown, and a disabled network cache, then reloading and interacting with the page to capture local LCP, CLS, and INP results. That setup is harsh on purpose. It shows whether the problem reproduces on a slow phone, not just on your laptop.
Local results still miss things. A banner that shifts after load or a script that stalls typing may never fire during a quick lab run. So compare your local test against field data in Search Console and the Chrome UX Report, split by mobile and desktop. Expect a lag of two to four weeks before a release fully shows up in that rolling window.
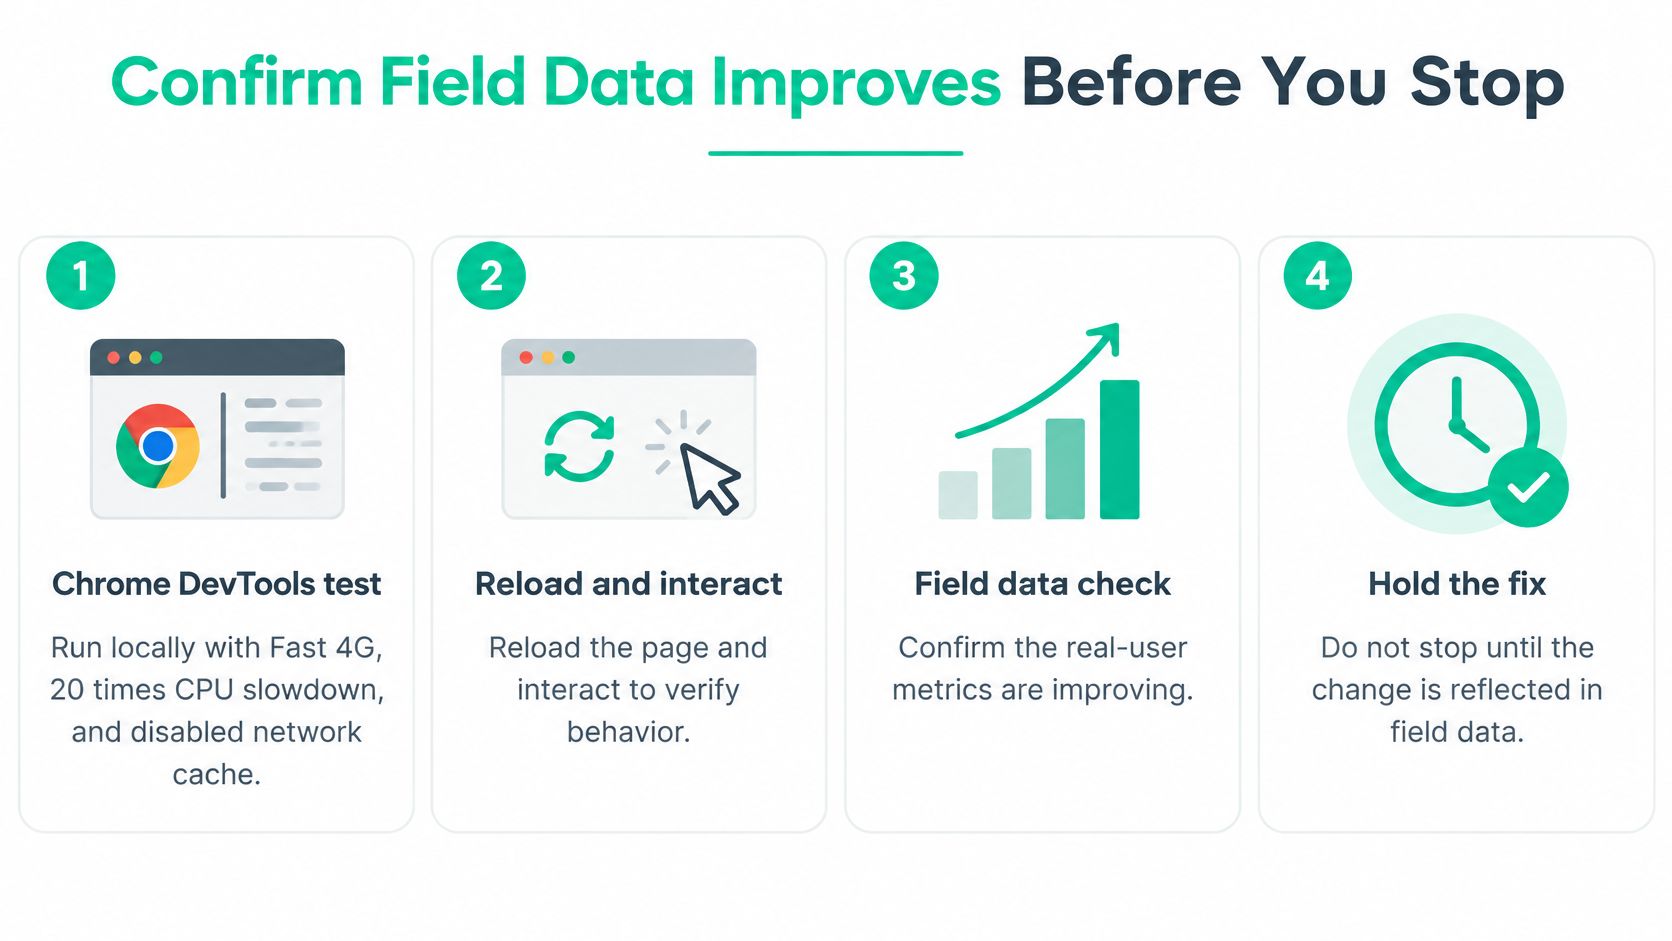
Your closing checklist
- Confirm the baseline. Match today's numbers against the scores and dates you saved before the release.
- Deploy one change set at a time. If you ship image, script, and layout fixes together, you won't know which one worked.
- Retest on throttled mobile. Reload and interact, don't just watch the page load.
- Watch the 75th percentile for a full cycle. Short spikes either way don't settle the question.
- Check leads and conversions. A faster template that broke a form is not a win.
- Log what changed. The next template should start from the method that just worked.
Then make a clear call. If the template passes all three metrics on mobile and desktop, move to the next template on your list. If one metric still fails, go back to the fixes for that metric only. Don't restart the whole site.
Our SEO service includes technical SEO audits and Core Web Vitals optimization, so this kind of template by template follow through is part of normal work for us, not an extra project after rankings stall.
If your product, service, or lead pages are failing in Search Console and you don't have time to profile templates one by one, Assertive Agency can run the technical audit, fix the LCP, INP, and CLS issues by template, and confirm the change in field data. Visit Assertive Agency to talk through your site and get a plan built around the pages that bring in revenue.
